An Introduction to SQL Server Reporting Services (SSRS)
Background
What Is SQL Server Reporting Services (SSRS)?
SQL Server is Microsoft’s implementation of a SQL based Relational Database Management System (RDBMS) and is part of the Microsoft Business Intelligence (BI) platform. There will be more posts on the other tools later, but for now know that the BI platform includes:
- SQL Server
- SQL Server Analysis Services (SSAS, which is an online analytical processing (OLAP) and data mining tool)
- SQL Server Integration Services (SSIS, which is a tool for extracting, transforming, and loading data, otherwise known as ETL), and
- SQL Server Reporting Services (SSRS)
SSRS is a way for businesses to easily deliver and report the information in their SQL Server database. Like SQL Server, SSRS is server-based and scalable. It provides many ways for the user to report data (such as traditional paper reports, web-based reports, interactive content, it can even deliver reports to inboxes). I think Qlik tries to solve many of the same problems that SSRS tries to solve. If you are interested in an overview of Qlik, check out my post here.
Features
SSRS is a reporting tool but what does that mean? Below is a list of some of the features:
- Retrieve data from many different data sources, not limited to SQL Server (such as Oracle, Access, Essbase, and many others)
- Display data in many ways (tables, free form, charts)
- Export to many formats (HTML, PDF, XML, CSV, TIFF, Word, Excel)
- Report navigation
- Embed graphics and images and external content
- Integrates with SharePoint
- Subscription-based and on-demand reports
SSRS User Groups
There are three different types of users for SSRS as defined by Microsoft:
- Information Users
- These people use static, predefined, and preformatted reports. They only need a low level of technical expertise.
- Information Explorers
- These people can interact with reports by doing things like applying filters. They need a medium level of technical expertise.
- Analysts
- These people develop the reports and perform calculations (like linear regressions or trend analysis). They are often the people that publish reports to the information users and explorers. They need a high level of technical expertise.
SSRS Tools
There are three main SSRS tools:
- Report Viewer
- As the name implies, this tool view reports. It works over the web through a website that it sets up called Report Manager.
- Report Builder
- This is the tool used to generate reports. A cool thing about this tool is that users don’t need to know SQL to effectively use it!
- Report Designer
- Similar to Report Builder, the Report Designer is used to build reports. However, if you need to generate an advanced report, you’ll have to move over to the Report Designer.
Using SSRS
Configure
First, we need to configure the reporting services. Open the Reporting Services Configuration Manager by going to Start -> Microsoft SQL Server 2016 -> Reporting Services Configuration Manager (or, simple search for it). 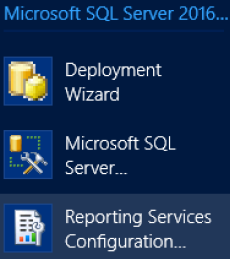 When it first opens, it should look similar to this:
 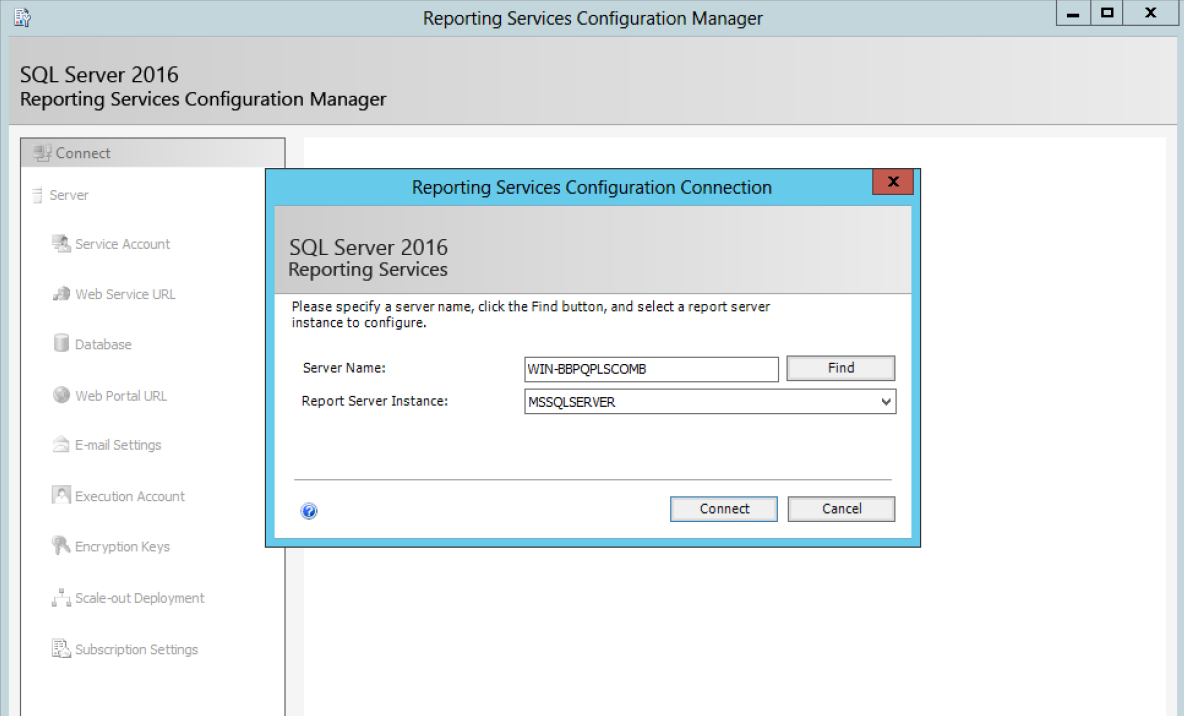 Make sure the server name and instance are correct. I named my instance ‘SQLSERVER2’, so I had to press the down arrow and select that from the list. After that, press Connect. Next, click Web Service URL on the left panel so that we can configure our Report Server Web Service. To accept the default values and configure the service, click Apply.
 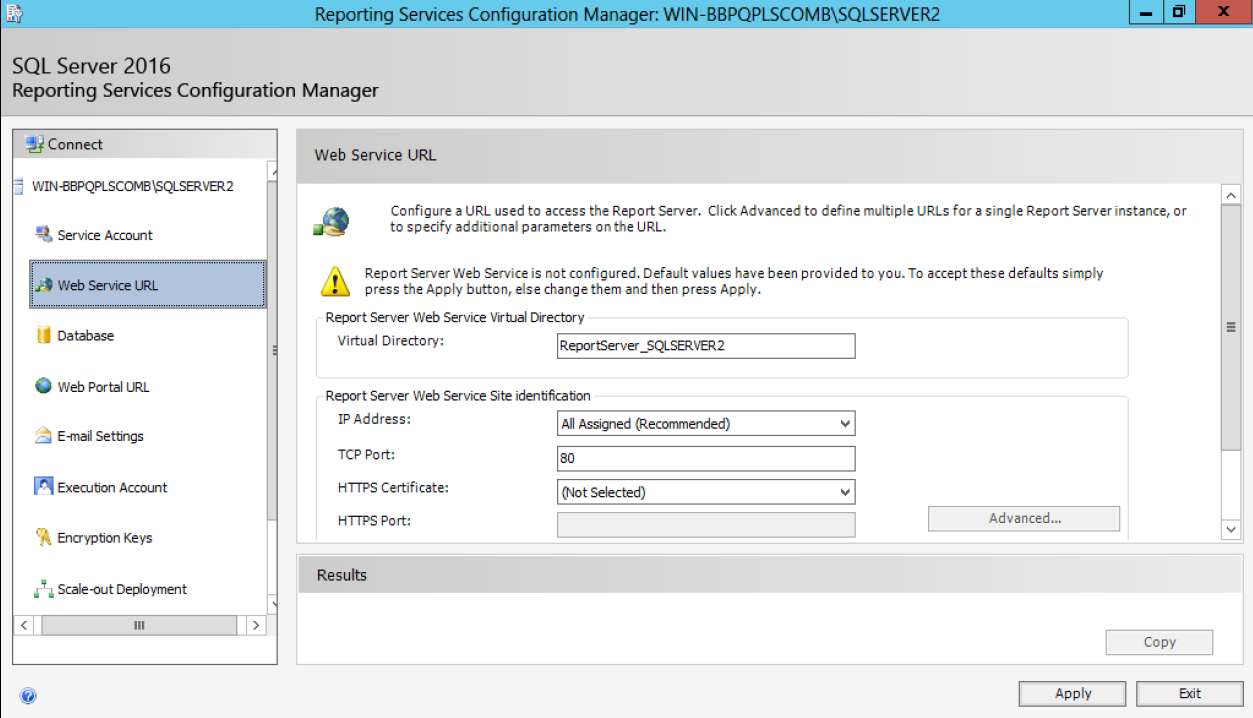 It might take a few moments for everything to configure. Once it is complete, our Report Server Web Service URL should now be active (it changed to a blue link). If you click on it now, it should open up into Internet Explorer (but there won’t be anything there). Next, click Database from the left panel. In this step, we will configure the SQL Instance that will host our Reporting Services Report databases.
 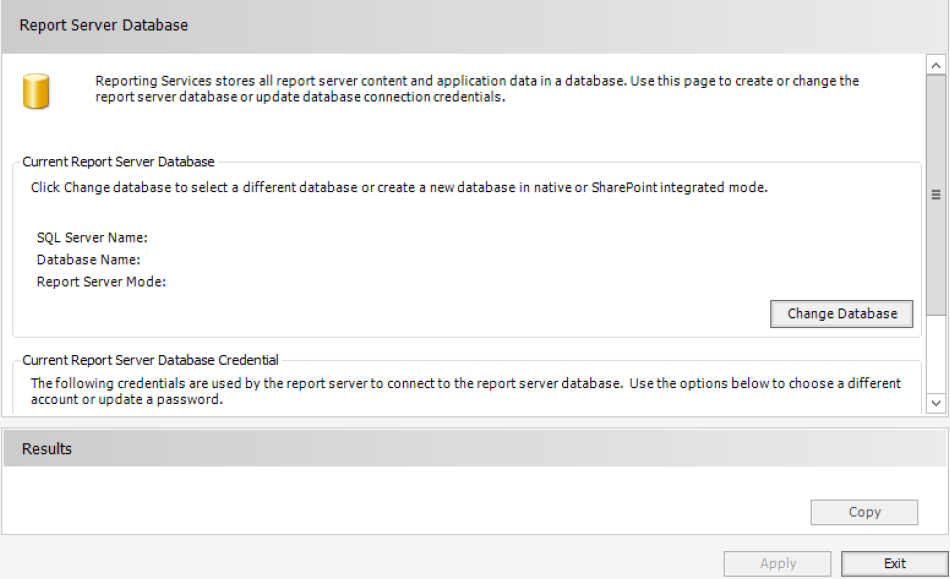 Click Change Database to open the Report Server Database Configuration Wizard. We first can choose to either create a new report server database or choose an existing one. I don’t think I have an existing one, so I went ahead and chose to create a new report server database. The next page sets up the Database Server. Here, under Server Name we need to put \Instance Name. For me, this is \SQLServer2. Once everything is correct, click Test Connection. A box should pop up telling you the connection succeeded.
 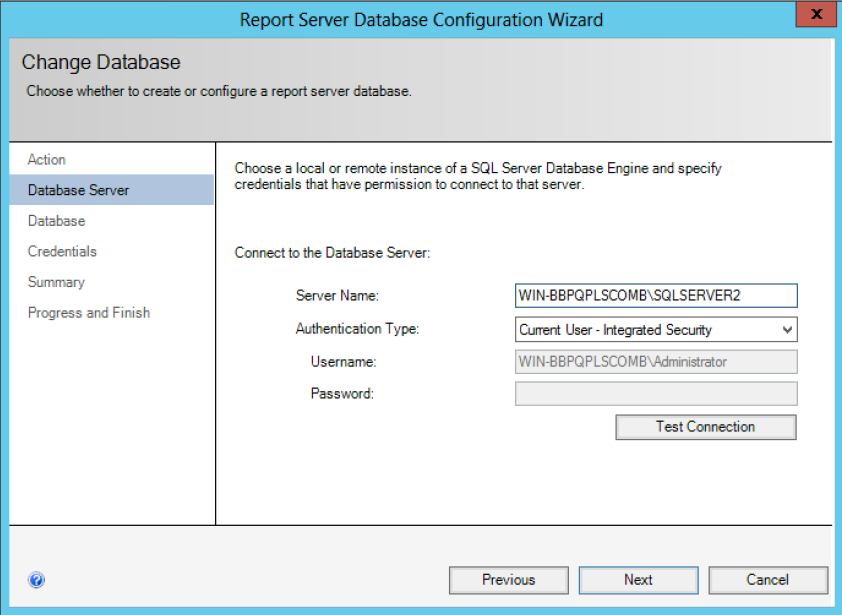 I used the default settings for the next two panels, Database and Credentials. Once we get through all of these pages, it will go through and configure our report and temp databases. If you leave the Server Name as just the machine name in the Database Server page (for me, this would be leaving it as just WIN_BBPWPLSCOMB), you will receive an error that states the Report Server Configuration Database “msdb” cannot be opened due to inaccessible files or insufficient memory or disk space. Next, on the Report Report URL *page we can change our default URL. I’ll keep mine how it is and just click Apply.
 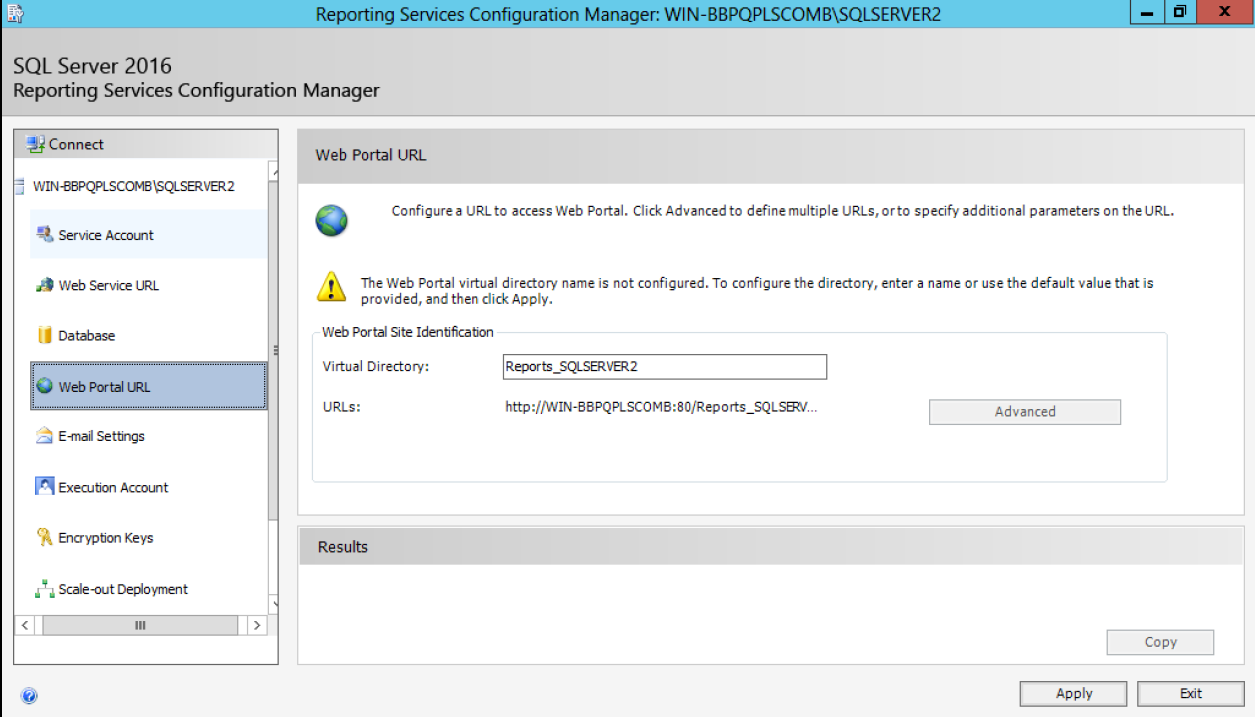 Next is the *E-mail Settings page. If you plan on using the e-mail SMTP delivery method, you can put that information in on this page. I won’t be using that, so I left it all blank. The Execution Account is also optional. You want to set up an account here if you don’t want to set credentials for all of your data sources and/or you want your data source to work even when the users can’t really enter their credentials (an example of this might be subscriptions). I’ll leave this blank for now. Next is the Encryption Keys configuration page. Here, we can backup, restore, change, or delete the encryption keys. You definitely want to backup your encryption keys. These keys hold all of the credential information. You want to get on a backup schedule for your keys. To backup our key, click the backup button. A window will come up asking for the file location to save a copy of the key. Ideally, this will be on a different server (somewhere that you store your credentials, like a central repository). I’ll just save mine on my C: drive since I don’t have a central repository. Then, set a password. This password will be used if you ever need to restore the key, so make it something that you can remember.
 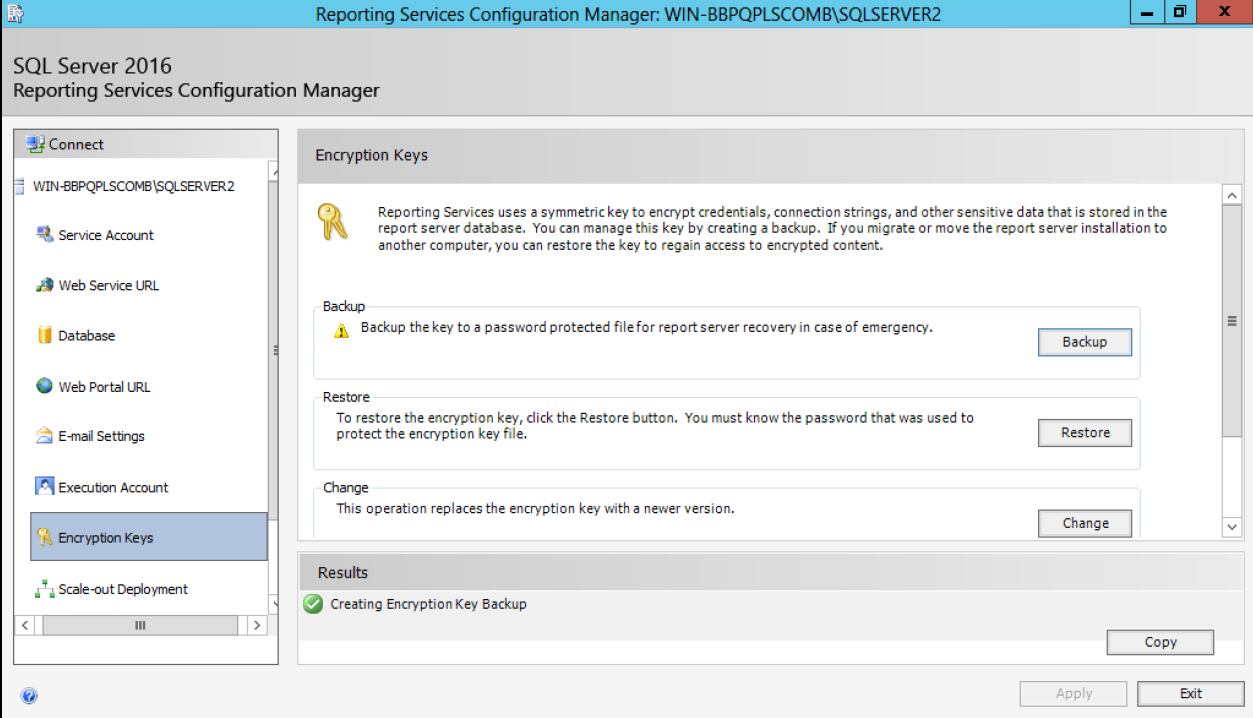 Finally, we have the Scale-out Deployment page. This is used if you want to add other reporting services. I won’t do this now, so I’ll just click Exit.
Testing Our Configuration
Now we can test to see if we got everything set up correctly. You should be exited out of the configuration manager. Open the configuration manager back up and go to the Web Portal URL page. Click on the URL there and wait for the page to load (it may take several minutes). The end result should look like this: 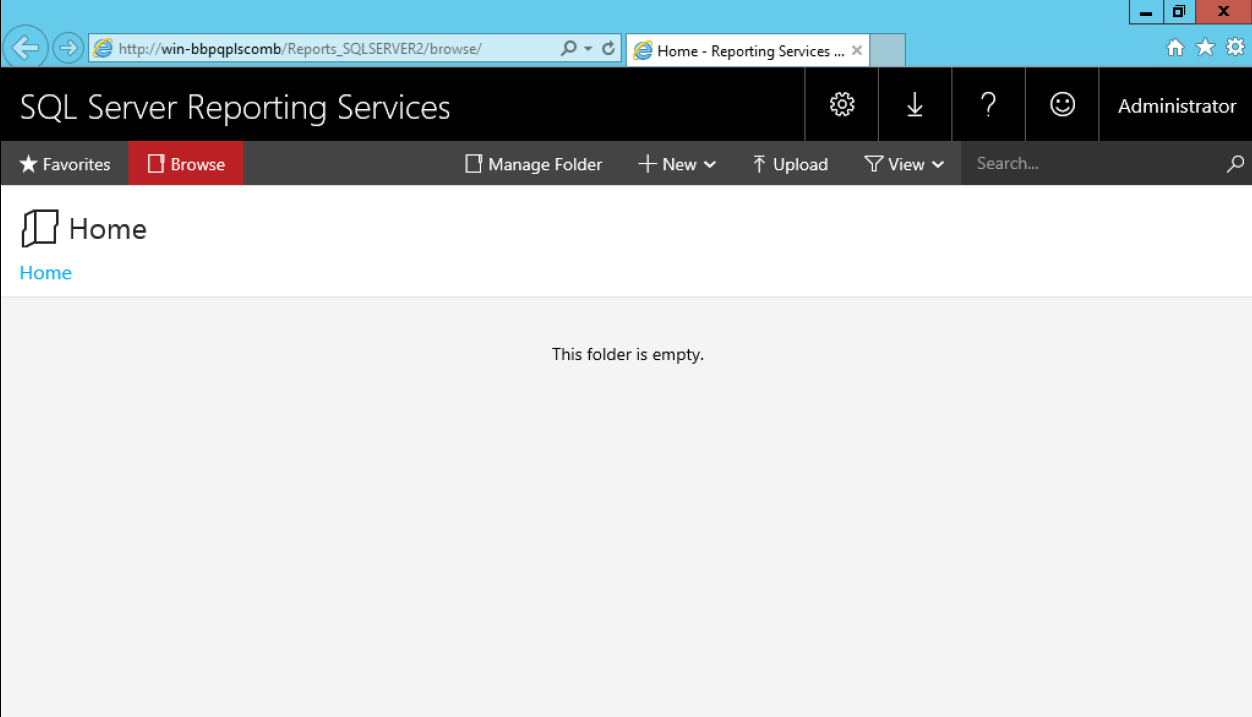 That’s it! This was a really good project for me and I feel like I learned a lot. It was frustrating at times because I couldn’t easily and quickly find solutions to the errors I was facing. I think with time, I’ll learn how to better search for my issues and it will go easier. Have questions or suggestions? Please feel free to comment below or contact me.