Tracking Board Game Plays Part 2: Results
My board game plays spreadsheet is the spreadsheet I have spent the most time working on and it is one that I am proud of. You can view it here.
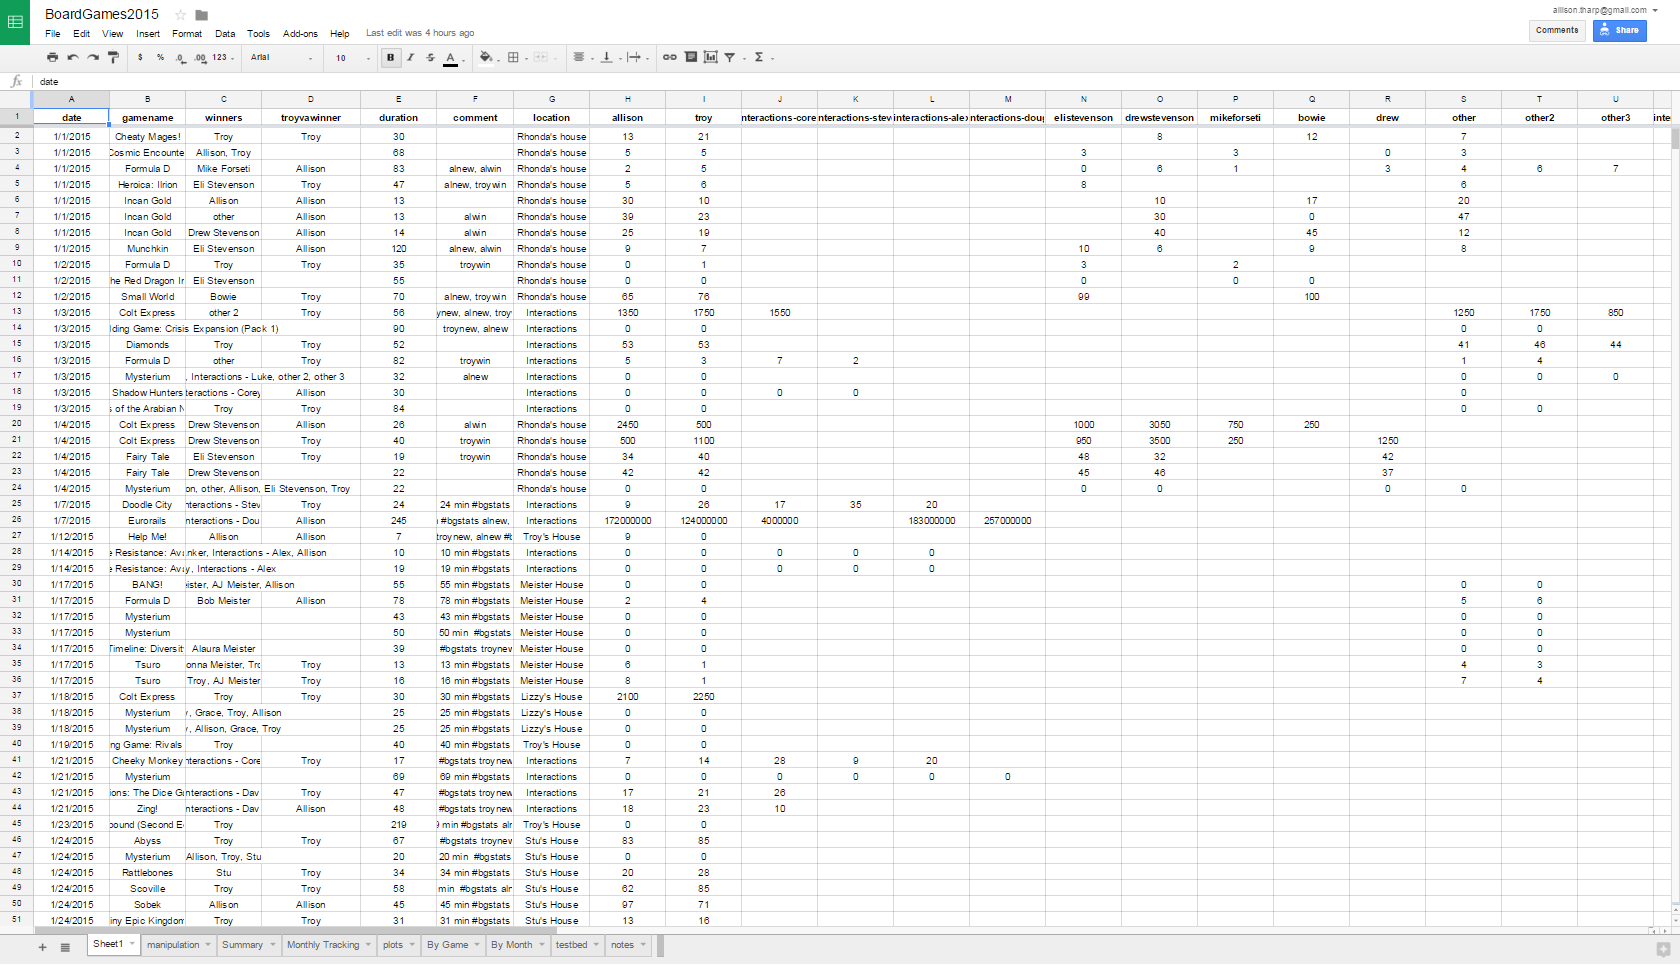
I learned in one of the first iterations of this project that you want one sheet for the raw data and nothing else (so no manipulations or calculations in that sheet). That sheet for me is the first one, called ‘Sheet1’. The Python script we previously discussed fills in all of this information except location (the BGG module can’t yet pull in location, though it is something BGG tracks). This isn’t ideal as I would like it to be fully automated but at the same time it is easy enough to fill in where the game took place. The next sheet is called ‘Manipulation’. This sheet is very similar to Sheet1 because each row corresponds to the same play. In other words, row 17 in Sheet1 corresponds to the same game as row 17 in Manipulation. I use the Manipulation sheet to calculate many things. The first few columns are for total points scored per play for all players (Tot Points), my boyfriend’s total cumulative score (Troy Points Tot), my cumulative points (Al Points Tot).  Some games score points in thousands or even millions. Since most games do not score that high, the high scorers can really throw off your total points over time. Therefore, I also track our points without high scorers (games where our point difference is greater than 100). These results are in the columns Troy Points and Al Points. If a game is left out, it gets highlighted in green and the font turns to red. This is all automated through if statements and conditional formatting. This sheet has many more calculations, but I believe the rest are pretty straight forward. The purpose of this sheet, again, is to do calculations. I wanted to keep the calculations separate from the actual data so I created the separate sheet. The next sheet is ‘Summary’. This sheet has a summary of all the plays by game name, among other things.
 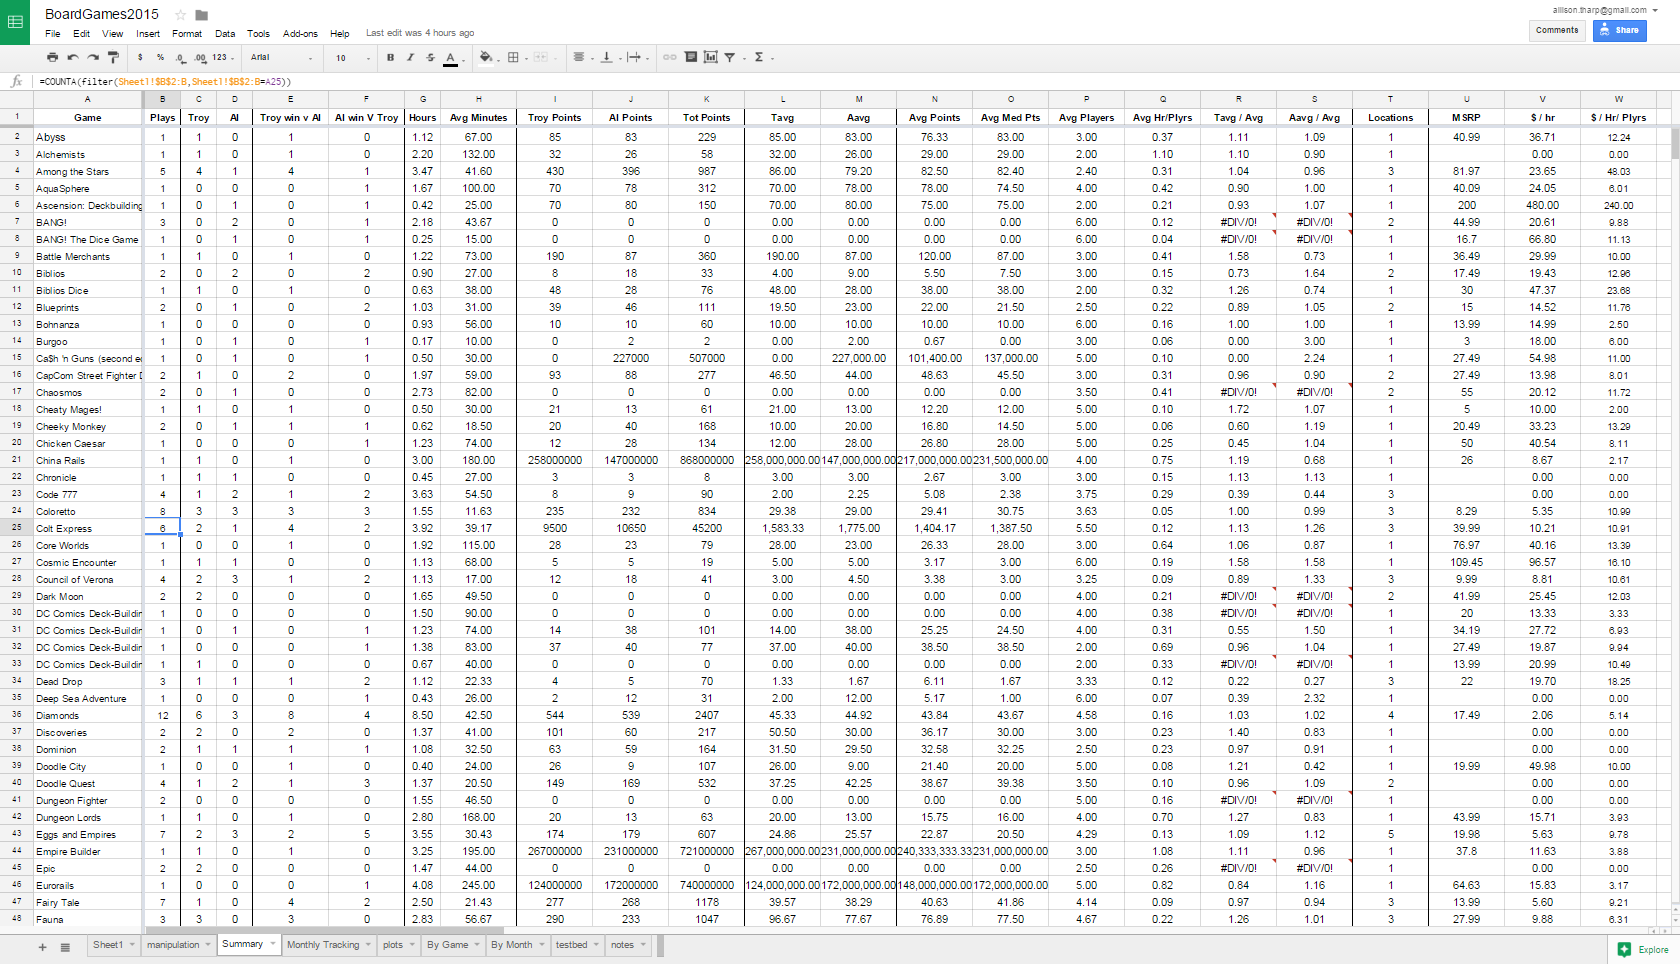 Many of the formulas in this sheet rely on Sheets filter function. This is an incredibly powerful function that I find myself using again and again. For instance, in order count the number of times a specific game has been played, I use:
=COUNTA(filter(Sheet1!$B$2:B,Sheet1!$B$2:B=A25)) The filter portion of this says to filter out the game names of the raw data sheet (Sheet1) anytime the game name is equal to the name in cell A25. Then, I simply count how many items are in the list with COUNTA. This is the general formula that is being used in column B (but the ‘A25’ portion starts at A2 and increases accordingly). For each game, I track the total number of plays (Plays), the number of times Troy or I won (Troy, Al), the number of times Troy beat me or I beat him but we didn’t necessarily win the game (Troy win v Al, Al win v Troy). I also track the total number of hours and the average length of the game (Hours, Avg Minutes). I track a lot of things regarding points: Troy’s total points, my total points, everyone’s total points, Troy’s average, my average, everyone’s average and median points. Next, I track the average number of players for the game and the average number of hours the game takes per player. Columns R is Troy’s average points divided by everyone’s average and column S is the same for me. This will give a percent over or under average for both of us. Starting in Column Y, I have a summary of plays per month. These calculations are all done in the ‘Monthly Tracking’ spreadsheet and are pretty straightforward. Again, I use the FILTER command a lot in that sheet. 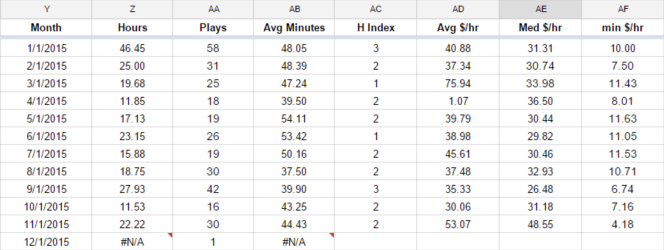 For each month, I track how many hours we played, how many times we played, the average game length, and the H index. H index is a measure typically used for scientific research that gives a number based on a person’s most cited papers and the number of citations they have received in other publications. In January, you can see I had an H index of 3. This means I played 3 games at least 3 times. I may have played one game 10 times, another 7 times, and another 4 times. But, the next most played game was 2. Therefore, I played 3 games at least 3 times. An H index of 9 would mean 9 games played at least 9 times and so on. I also try to track the cost of the game, either what I paid or what a fair market value price would be (this is done in the Manipulation sheet). With this information, I can calculate the average, median, and minimum dollar per hour games per month (and overall). Also in the Summary sheet, I have a section for overall information. It shows the total plays for the year as well as how many games we need to play each week to get our goal (currently our goal is 365 and we need to play 8 games this week to stay on track). As of today, we have played 168 unique games, 93 were new to both of us, 15 were new to just me, and 1 was new to only Troy. Our overall H index for the year is 7.
 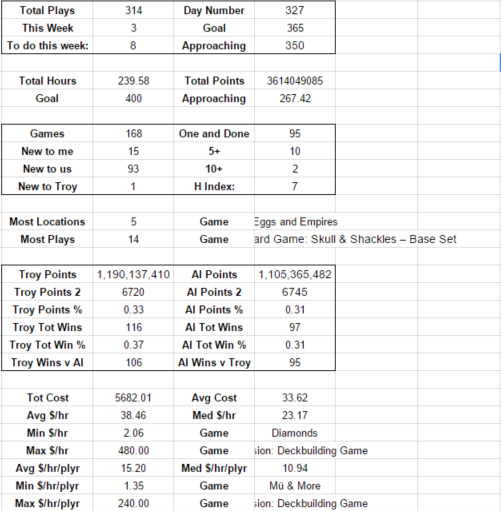 Also in this section, I can see that Eggs and Empires has been played in the most locations (5 different locations) but Pathfinder Skull & Shackles has the most plays at 14. We have played over $5600 worth of games this year. The average cost per hour is $38 but the average cost per hour per player is $15. The game we have gotten the best ‘bang for our buck’ has been Diamonds. It has cost us only $2 per hour! The next sheet, ‘plots’, is simply several plots. They are all pretty self explanatory so instead of explaining them, I’ll just show a few below:
  [caption id=”attachment_236” align=”alignnone” width=”600”]
 Win spread. Troy is positive, I am negative[/caption]
 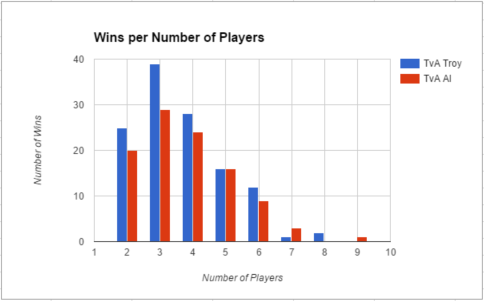 There are a few more sheets, but the general idea of what is tracked and how it is tracked is continued. You can view the spreadsheet here.