Machine Learning Part 3: What Makes a Good Feature?
Google has released their 3rd video in their machine learning series. It is titled What Makes a Good Feature? - Machine Learning Recipes #3. You can check out my other posts on machine learning here. In this post, we will discuss what makes a good feature. Coming up with a good feature is one of the most important aspects of machine learning because the classifiers in a machine learning program are only as good as the features you provide. Recall from our previous discussions on machine learning that a classifier is a function that takes some input (the feature) and outputs a label (its calculated guess as to what the object is).
What Makes a Good Feature and How Can You Tell?
For binary classification, a good feature will make it easy to distinguish between two different things. Lets say that we want to tell the difference between a man and a woman. For this first example, we’ll use two features: the person’s height in centimeters (cm) and the person’s hair color (hint: one of these is a good classifier and one of them is a not so good classifier!). For our simple example, lets make some assumptions:
- Men are usually taller than women
- People only have two hair colors (brown and blonde) and the hair color does not depend on the sex of the person
If we pretend we are the classifier (in other words, you are responsible for determining the sex of a person based on height and hair color), we can pretty easily see that we would much rather know the height than the hair color since both men and women can have brown or blonde hair.
Visualizing The Data
To see why height is more important than hair color, lets visualize the data. On average, American men tend to be about 13 cm taller than women. However, this certainly isn’t always the case - there is a lot of variation in the heights of American men and women. According to Wikipedia, the average American man is about 176 cm and the average American woman is about 163 cm. Lets assume that the height of both men and women is distributed normally at +/- 20 cm. To see a histogram of this data, we can use the Python code:
import numpy as np
import matplotlib.pyplot as plt
men = 500
women = 500
men_height = 176 + 20 * np.random.randn(men)
wmen_height = 163 + 20 * np.random.randn(women)
plt.hist([men_height, wmen_height],stacked=True, color=[‘b’,’m’])
This will output the following histogram: 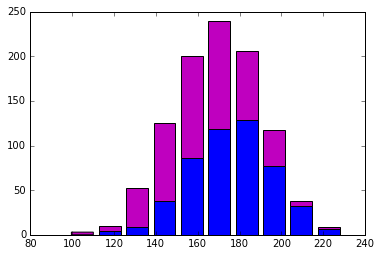 In this histogram, blue represents the height of men (in centimeters) and pink represents the height of women (in centimeters). If you were trying to use this to determine the sex of a person, how would you do it? Lets take a look at an extreme case - the second to last bar from the right, highlighted below.
 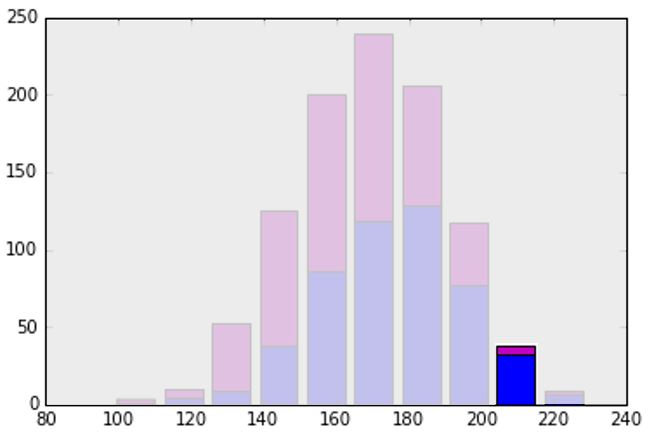 This highlighted section is for people that are approximately 210 cm (about 6’10”) tall. We can see that a much larger percentage of people this tall are male (blue) than female (pink). Similarly, look at the third bar, which shows people who are about 130 cm tall. People of this height are much more likely to be a woman than a man. What about a person in the middle? If a person is about 170 cm tall (about 5’6”), the probability for either male or female is pretty close. This means that height is a useful feature but it isn’t perfect. Because of this, when we work with machine learning we almost always will want to use more than one feature. Otherwise, we could just write an if statement (if the person is 200 cm or taller, they are probably a man).
What Types of Features Should I Use?
A good way to figure out the type of feature to use is to simply think about it (I know, right?). Lets go back to pretending we are the classifier - what kind of data would we want if we had the task of determining if a person was a man or a woman? What other things would you want to know? Perhaps weight, shoulder width, hip to waist ratio, chest size could all be good. There isn’t a magic number for how many features is the right amount, but a good starting point is to ask yourself how many you would need to solve the problem yourself.
What Types of Features Should I Avoid?
Remember in our fictional world that men and women only have blonde or brown hair? Much like in real life, in this thought experiment we are going to assume that hair color is not an indicator of sex. That means that approximately 50% of men have blonde hair and 50% of men have brown hair. The same is true of women. That means this feature tells us nothing because the hair color doesn’t correlate to the sex of the person. In fact, including useless features can hurt your training data, particularly if you have a small sample size! This is because it might seem like there is a correlation, particularly in a small data set, when there is in fact none. Be mindful of this and try to avoid useless features. We also want our data to be independent, which means that every feature gives you different information. For example, if one of our features is height in centimeters, a bad feature to add to this would be the height in inches. The height in inches is exactly the same as the height in centimeters - adding this might cause the algorithm to think that this feature is more important than it really is. Try to remove highly correlated features (such as height in inches and height in centimeters) from your training data. Finally, avoid features that are hard to understand. In the video, Google uses the example of mailing a letter. If we want to try to guess how long it will take to mail a letter from one city to another, a good feature would probably be the distance in miles. A bad example would probably be the latitude and longitude coordinates of both cities because it is much harder to understand. The distance in miles is one simple number that can explain the same concept as latitude and longitude, but in a much simpler way. In other words, if we used the latitude and longitude, we would have to also learn how those work and their relationships before we could really understand how far apart the two cities are (which is what we really want to know).
Thoughts and Conclusions
I’m still very excited about machine learning. I feel like the pace of this course is perhaps a little slow; however, I also know that there is an abundance of information out there for me to learn machine learning on my own and I haven’t had the time to really do it. Because of that, I am grateful for the slower pace of Mr. Gordon’s Youtube class and I can’t wait for the next episode! Have questions or suggestions? Please feel free to comment below or contact me.