An Introduction to R
I’ve always been interested in statistics. I have known about R for awhile and decided it was time to look into it. In this tutorial, we will
What is R?
Installing R and RStudio with Windows
First, click the Download R linkfrom here. Following the installation wizard prompts: 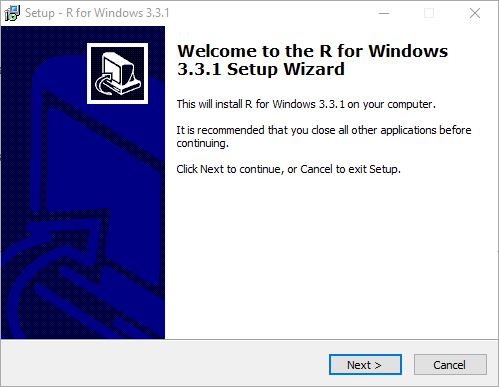 Once that is complete, click the green DOWNLOAD link for RStudio Desktop from here. Next, click on the installer that corresponds to your operating system. Again, follow the installation wizard prompts:
 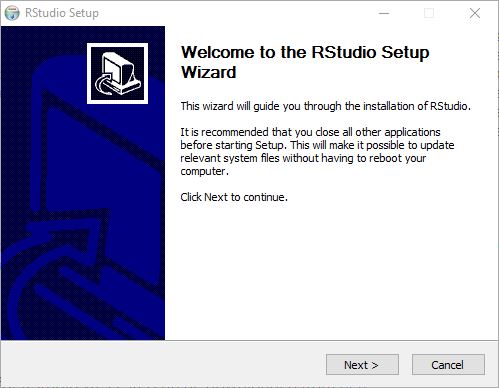 To run RStudio, press the Windows key and search for ‘RStudio’. The main window for RStudio will open up and should look similar to this:
RStudio
By default, RStudio is broken up into three windows. On the left is the Console, where we will write all of our script and see our outputs. The right portion is broken into two parts. On the top is the Environment. This will show you all of the variables you have set and their values. Miscellaneous things are stored on the bottom. For instance, all of our plots will be stored here, if we ask for help, it will display here, etc. Lets begin with a really simple example. Lets set two variables: x = 5 and y = 7. To define a variable, the syntax is:
variableName <- variableValue
For us, this will be:
x <- 5
y <- 7
This syntax is different than what you would find with most other languages (C, Matlab, Python, etc). Instead of using an equal sign, we use an arrow to define a variable. Next, we can perform simple math just like you would guess:
x+y
x-y
x*y
x/y
y/x
x^y
Here is my RStudio window:  As you can see, the Console shows all of the lines I have written as well as their outputs, and the Environment shows my two variables.
Import Your First Dataset
RStudio has several ways to import data. One of the easiest ways is to import via URL. This link (https://data.montgomerycountymd.gov/api/views/6rqk-pdub/rows.csv?accessType=DOWNLOAD) gives us the salaries of all of the government employees for Montgomery County, MD in a CSV format. To import this into RStudio, copy the URL and go to Tools -> Import Dataset -> From Web URL… 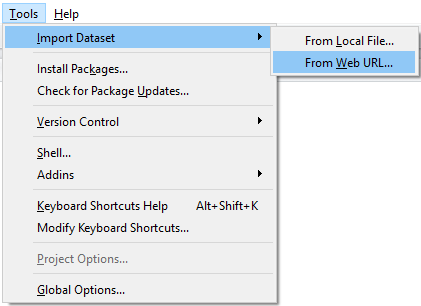 A window will pop up. Paste the URL into this and click next. The Import Dataset window will open. Here, we can give our data a name and make sure it gets formatted correctly. Click ‘Yes’ next to ‘Heading’ so that the headers (FullName, Gender, Etc) follow through. After that, click Import.
 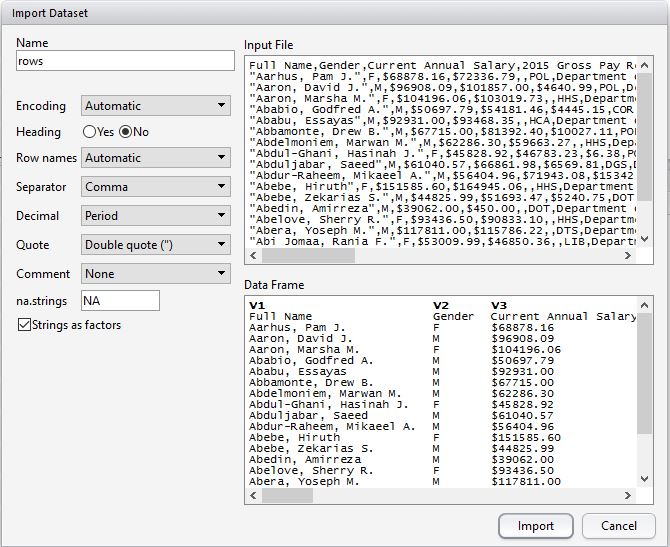 Now, you should see an additional window in Rstudio - the table in the top right quadrant is our new dataset, Rows. The data looks good, but we need to strip the dollar signs from several columns. To remove the dollar sign from the Current.Annual.Salary column, we use the command:
rows[[“Current.Annual.Salary”]] <- lapply(rows[[“Current.Annual.Salary”]], function(x) as.numeric(gsub(“[,$]“, “”, x)))
Next, we need to convert the data in the column we care about to numeric (the Current.Annual.Salary column is current a list). To do this, we use the command:
rows[[“Current.Annual.Salary”]] <- sapply(rows[[“Current.Annual.Salary”]], as.numeric)
Finally, we can get an idea of how the Current Annual Salary looks by running the command:
summary(rows$Current.Annual.Salary)
The summary() function gives us the min, 1st quadrant, median, mean, 3rd quadrant, and max value for the column. Here, we can see that the lowest paid government employee in this county has an annual salary of $7,200, the highest paid has a salary of $303,100, and the mean salary is $72,460. I have a lot to learn about R still. I’m not convinced it will be a worthwhile tool for me, because I feel like Python can do all of this and more. I am keeping an open mind and I’m excited to see what I learn about R, programming, and statistics along the way! Have questions or suggestions? Please feel free to comment below or contact me.